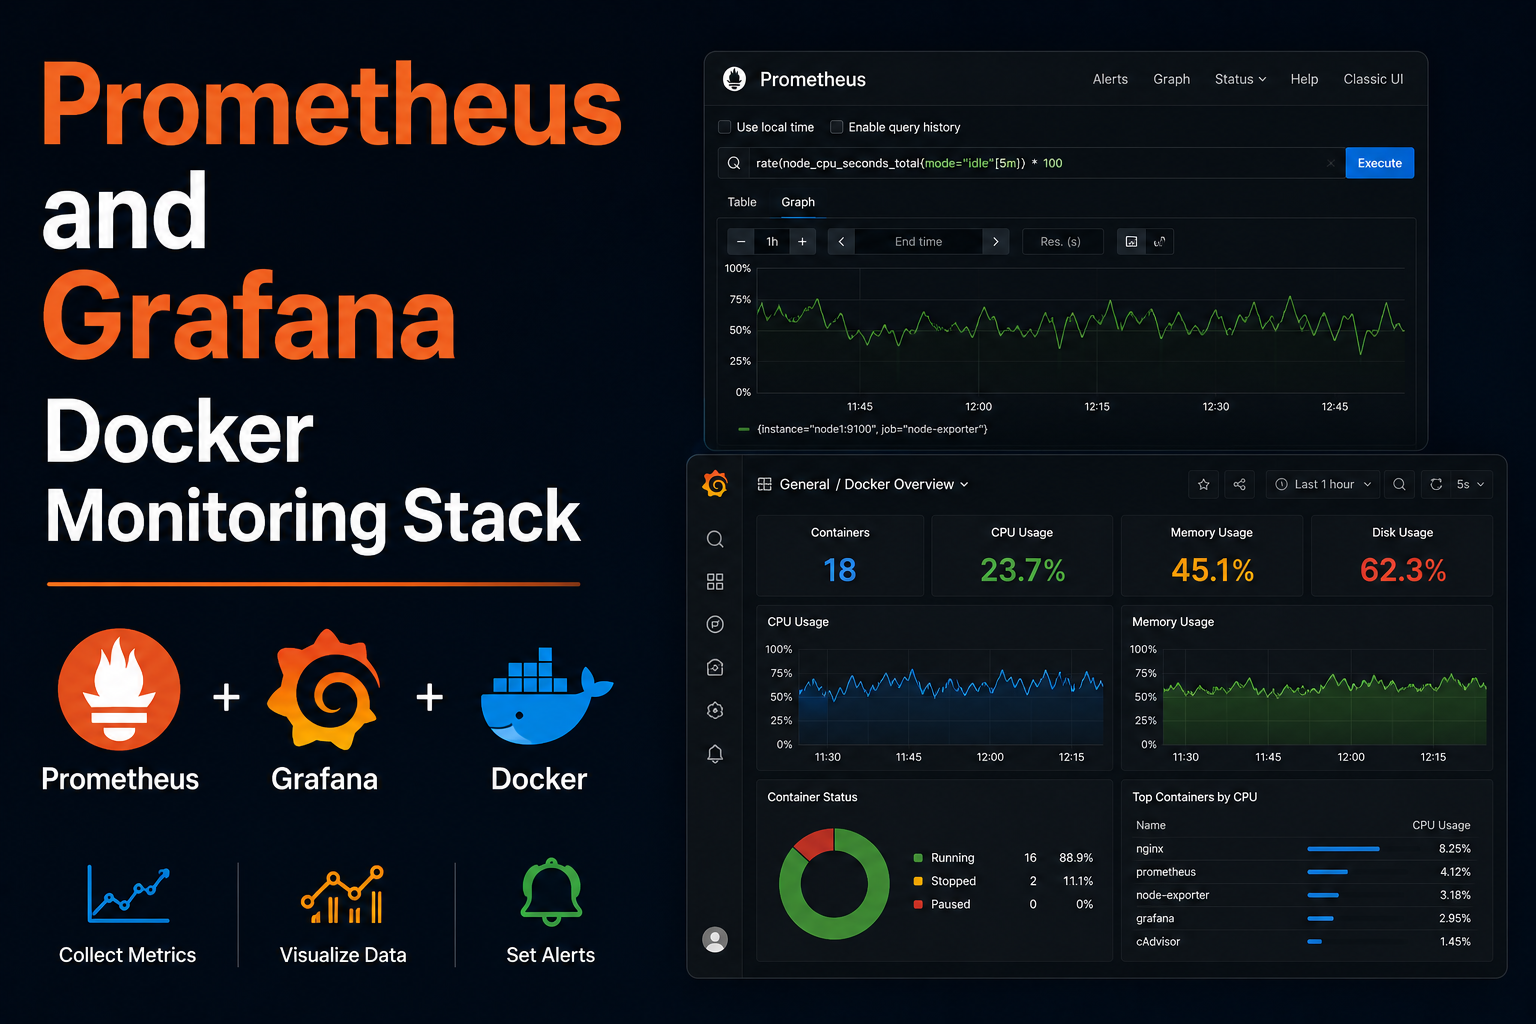
Prometheus scrapes time-series metrics; Grafana visualizes them. Together they form the default observability stack for homelabs running Docker, Proxmox, Synology, routers, and custom exporters. Unlike SaaS monitoring, you own retention, dashboards, and alert routing—at the cost of maintaining Prometheus TSDB disk usage and dashboard JSON in git. This guide deploys Prometheus and Grafana via Docker Compose, adds node_exporter and cAdvisor, wires Traefik for Grafana HTTPS, defines alertmanager basics, backup paths, and troubleshooting scrape failures.
Prerequisites
Reserve 20–50 GB disk for Prometheus retention depending on scrape interval and label cardinality. Docker
and an external proxy network help if Grafana is public. Create ~/docker/monitoring with subfolders
prometheus, grafana, alertmanager. Understand that Prometheus is pull-based—targets must be reachable
from the Prometheus container network.
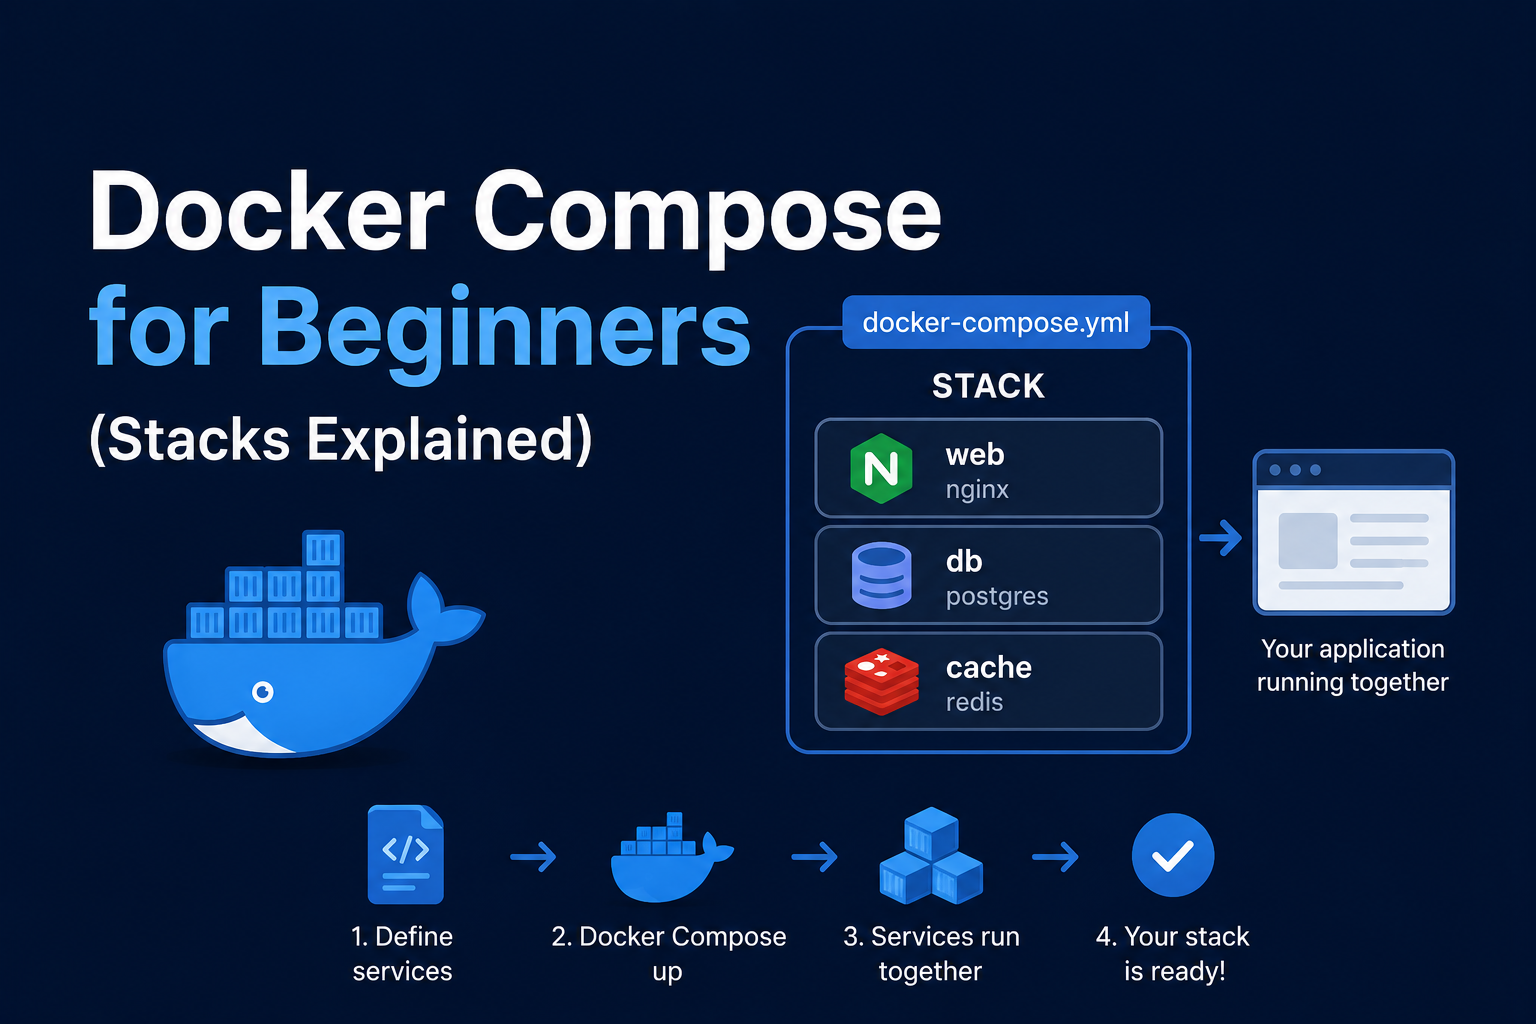
Docker Compose stack
services:
  prometheus:
    image: prom/prometheus:v2.55.1
    container_name: prometheus
    restart: unless-stopped
    volumes:
      - ./prometheus/prometheus.yml:/etc/prometheus/prometheus.yml:ro
      - prometheus_data:/prometheus
    command:
      - --config.file=/etc/prometheus/prometheus.yml
      - --storage.tsdb.retention.time=30d
    ports:
      - "9090:9090"

  grafana:
    image: grafana/grafana:11.3.1
    container_name: grafana
    restart: unless-stopped
    environment:
      - GF_SECURITY_ADMIN_PASSWORD=${GRAFANA_ADMIN_PASSWORD}
      - GF_SERVER_ROOT_URL=https://grafana.example.com
    volumes:
      - grafana_data:/var/lib/grafana
    networks:
      - proxy
    labels:
      - traefik.enable=true
      - traefik.http.routers.grafana.rule=Host(`grafana.example.com`)
      - traefik.http.routers.grafana.entrypoints=websecure
      - traefik.http.routers.grafana.tls.certresolver=le
      - traefik.http.services.grafana.loadbalancer.server.port=3000

  node_exporter:
    image: prom/node-exporter:v1.8.2
    restart: unless-stopped
    pid: host
    volumes:
      - /proc:/host/proc:ro
      - /sys:/host/sys:ro
      - /:/rootfs:ro
    command:
      - --path.procfs=/host/proc
      - --path.rootfs=/rootfs
      - --path.sysfs=/host/sys

volumes:
  prometheus_data:
  grafana_data:

networks:
  proxy:
    external: true
Add prometheus.yml jobs for node_exporter:9100, cadvisor:8080, and blackbox HTTP checks as you grow.
Grafana setup
Login with admin password, change it, add Prometheus data source http://prometheus:9090 on the internal
Docker network. Import community dashboards by ID (Node Exporter Full, cAdvisor). Version-control
dashboards with file provisioning or export JSON to git.
Security notes
Do not expose Prometheus publicly without authentication—it reveals internal topology. Grafana admin is powerful; use OAuth via GitHub/Google if exposed. Restrict Traefik to VPN or Authelia for both services in paranoid labs. Sanitize labels that include hostnames if screenshots leave the house.
Backup
Back up grafana_data volume and prometheus_data if you accept restore to same version. Export dashboards
to git; they are more valuable than TSDB history for homelabs. Snapshot prometheus.yml and alert rules.
Recording rules and alertmanager configs belong in git.
Reverse proxy context
Grafana behind Traefik needs GF_SERVER_ROOT_URL matching public URL. Prometheus often stays LAN-only on
9090. If you must proxy Prometheus, add basic auth middleware. WebSocket for live dashboards works through
modern proxies by default.
Troubleshooting
Target down: DNS on Docker network, wrong port, or firewall between stacks—curl from inside Prometheus container. No data: start time range, scrape interval, or exporter not running. Grafana login loop: cookie secure flag vs HTTP mismatch—fix root URL. Disk full: reduce retention or increase volume.
Key takeaways
Prometheus plus Grafana gives homelabs visibility without cloud bills. Start with node_exporter, add services gradually, keep Grafana behind TLS, and back up dashboards and config—not just TSDB blocks.
Homelab operators should treat documentation as part of the deployment: record image tags,
volume paths, environment variables, and the exact Compose file revision in your internal wiki
or git repository. When you rebuild the host six months later, those notes prevent guesswork
about which UID owned a bind mount or which DNS name the reverse proxy expected. Version-control
your stack directory and review diffs before docker compose up -d, especially when labels or
network names change.
Capacity planning remains underrated in small labs. Monitor CPU, memory, disk I/O, and network utilization for a full week under normal household load before declaring hardware sufficient. Burst workloads—library scans, backup deduplication, VPN throughput tests, or 4K transcodes—often define minimum specs more than idle dashboards. Leave headroom for OS updates and one misbehaving container without cascading failures across unrelated services.
Change management applies even when you are the only administrator. Take volume snapshots or
export application backups before major upgrades. Roll back by restoring the previous Compose
file and pinned image digest, not by improvising latest tags under pressure. If you integrate
with Home Assistant, Authentik, or Authelia later, note which services assumed anonymous LAN
access so you can tighten authentication deliberately rather than breaking automations overnight.
Network segmentation pays dividends when a guest Wi-Fi VLAN, IoT subnet, and management LAN coexist. Place management UIs on administrative networks, expose only reverse-proxied HTTPS endpoints where required, and default-deny east-west traffic between VLANs except established flows you document. Logs sent to Loki or a centralized syslog host make correlating reverse-proxy errors with container restarts far faster than SSHing into each machine during an incident.